Predictions for Grazing Occultation of ZC 2275, 2013 Feb 4, near Brisbane
Graze profile
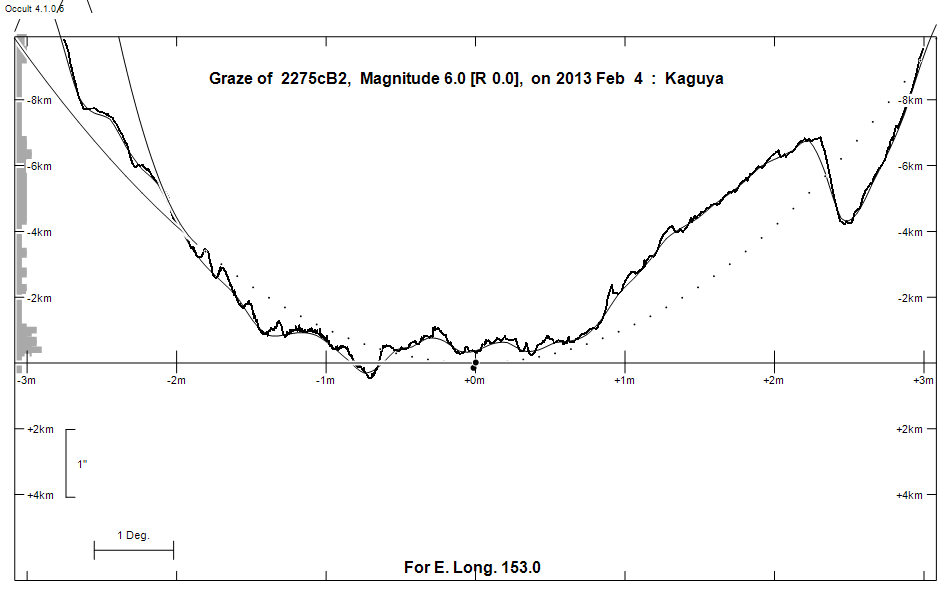
Grazing Occultation of    2275cB2      Magnitude 6.0 [Red = 0.0]  s
   R2275 = 47 Librae
Date: 2013 Feb 04 15h 57m,  to  2013 Feb 04 16h  3m

Nominal site altitude 50m

E. Longit.   Latitude     U.T.    Sun  Moon   TanZ   PA    AA      CA
   o  '  "    o  '  "   h  m  s   Alt Alt Az          o     o      o
 149  0  0  -25 15 47  15 57 15       21 102  2.65 195.4 182.09   3.31S
 149 30  0  -25 29 35  15 57 41       21 102  2.57 195.5 182.12   3.34S
 150  0  0  -25 43 26  15 58  7       22 102  2.50 195.5 182.15   3.37S
 150 30  0  -25 57 21  15 58 34       22 102  2.43 195.5 182.18   3.39S
 151  0  0  -26 11 20  15 59  1       23 101  2.36 195.6 182.20   3.42S
 151 30  0  -26 25 21  15 59 30       24 101  2.29 195.6 182.22   3.44S
 152  0  0  -26 39 25  15 59 59       24 101  2.23 195.6 182.25   3.47S
 152 30  0  -26 53 32  16  0 29       25 100  2.17 195.6 182.27   3.49S
 153  0  0  -27  7 42  16  0 59       25 100  2.11 195.6 182.29   3.51S
 153 30  0  -27 21 55  16  1 30       26 100  2.06 195.7 182.31   3.53S
 154  0  0  -27 36 10  16  2  2       27  99  2.00 195.7 182.33   3.55S
 154 30  0  -27 50 26  16  2 35       27  99  1.95 195.7 182.35   3.56S
 155  0  0  -28  4 45  16  3  8       28  98  1.90 195.7 182.36   3.58S

Path coordinates are referred to WGS84 (as used by GPS), with the
nominal site altitude being referenced to Mean Sea Level.

2275 is variable:
      2275 = NSV 7327, 5.89 to 5.96, V

2275 is double:
  Graze prediction is based on the mean position of AB 6.04 8.50 0.50" 115.6
 (HU 1274) Graze path of A 0.02 km south, and 0.1 secs earlier compared to prediction
  Graze path of B 0.17 km north, and 0.8 secs later compared to prediction

  AB 6.04 8.50 0.50" 115.6 (HU 1274) Graze path of B 0.19 km north, and 0.9 secs later compared to A

    C A S S I N I   R E G I O N   G R A Z E
                Librations  Long -2.35   Lat -1.45
                            P +182.30     D -1.09
      Illumination of moon  37%-
        Elongation of Moon  75
    Vertical Profile Scale  2.07 km/arcsec at mean distance of moon
   Horizontal Scale Factor  1.90 deg/min


At longitude 152.00:
Limiting Magnitudes for various telescope apertures (in cm)
      CA\Tdia   5    10    15    20    25    30    35
    -0.5      3.1   4.4   5.1   5.5   5.8   5.9   6.0
     1.5      4.8   6.2   7.0   7.4   7.7   7.9   8.1
     3.5      4.8   6.2   7.0   7.4   7.7   8.0   8.1
     5.5      5.6   7.0   7.8   8.3   8.6   8.9   9.0
     7.5      5.6   7.0   7.8   8.3   8.6   8.9   9.0

------------------------------------------------------------------------------
Double star catalogue details
WDS entries

  RA  Dec Name          Y1   Y2     N  PA  PA   Sep   Sep  M1    M2
15550-1923HU 1274      1904 2009   38 154 117   0.4   0.5  6.04  8.50 B5V       -010-014 -010-014 -18 4195 NVD  155500.37-192258.4

------------------------------------------------
Interferometric catalogue entries

155500.37-192258.4  ADS  9834                 HU 1274                   HD 142378    HIP  77939         15550-1923 N
    Date       PA              Sep                  M1             M2
  1983.4254   121.4     .      0.567      .          .      .       .      .       549  22   3.8   1  McA1987b Sc
  1985.5199   122.2     .      0.561      .          .      .       .      .       549  22   3.6   1  McA1987a Sc
  1987.2726   121.0     .      0.563      .          .      .       .      .       549  22   3.8   1  McA1989  Sc
  1988.1658   121.3     .      0.559      .          .      .       .      .       549  22   3.6   1  McA1993  Sc
  1989.2385   120.9     .      0.561      .          .      .       .      .       549  22   3.8   1  McA1990  Sc
  1989.3118   120.6     .      0.552      .          .      .       .      .       549  22   4.0   1  McA1990  Sc
  1990.2625   118.6     .      0.550      .          .      .       .      .       549  22   3.8   1  Hrt1992b Sc
  1990.3440   121.6     .      0.555      .          .      .       .      .       549  22   4.0   1  Hrt1993  Sc
  1991.25     121.2     .      0.553      .         6.111  0.003   8.118  0.016    511 222   0.3   1  HIP1997a Hh
  1991.25        .      .       .         .         6.15    .      7.97   0.01     505  97   0.3   1  Fab2000a Hh
  1991.25        .      .       .         .         6.09    .      8.21   0.01     435  70   0.3   1  Fab2000a Hh
  1991.56     117.5     .      0.67       .         6.04   0.01    8.50   0.02     530 100   1.4   1  TYC2002  Ht
  1991.56        .      .       .         .         5.99   0.01    8.93   0.02     430  90   1.4   1  TYC2002  Ht
  1994.5187   120.7     .      0.552      .          .      .       .      .       503  40   0.8   1  Hor2006c S
  1994.5187   120.3     .      0.545      .          .      .       .      .       503  40   0.8   1  Hor2006c S
  1994.5188   120.2    0.8     0.550     0.005       .      .       .      .       503  40   0.8   1  Hor1996  S
  2000.40     119.7    0.5     0.524     0.006      6.12    .      8.01   0.02    1250 380   3.6   1  Sht2002  A
  2000.40        .      .       .         .         6.13    .      7.78   0.01    2200 480   3.6   1  Sht2002  A
  2000.43     119.1     .      0.52       .         6.56    .      8.09    .      2154 323   3.6   1  Kou2005  A
  2009.2658   116.5    0.0     0.4751    0.0003      .      .      2.0     .       551  22   4.1   1  Tok2010  S


------------------------------------------------
AAVSO Variable star entry

       Variable identifier           Type        Max    Min  Ph  Epoch         Period
       NSV 7327                                  5.89   5.96 V
------------------------------------------------------------------------------
Results of Observer Scan                                    UT
Site                              Long.   Lat.   Dist.    h  m  s
Brisbane                          153.1  -27.5    31km   16  1  2
Bundaberg                         152.3  -24.8   198km   16  0 19
Rockhampton                       150.5  -23.4   256km   15 58 34
Lunar Limb Profile