Predictions for Grazing Occultation of ZC 1971, 2013 Mar 1 near Perth
Graze profile
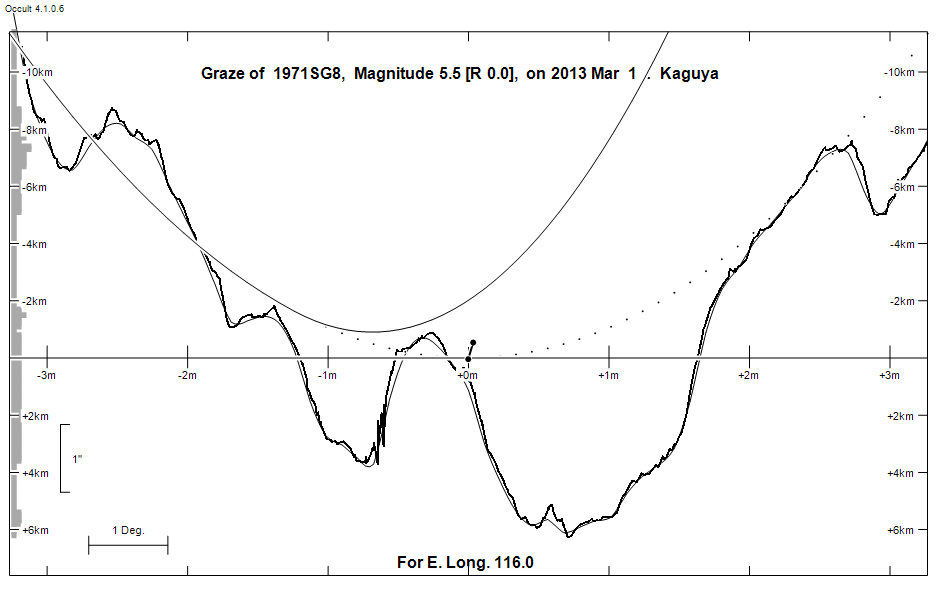
Grazing Occultation of    1971SG8      Magnitude 5.5 [Red = 0.0]
   R1971 = 86 Virginis
Date: 2013 Mar 01 15h 14m,  to  2013 Mar 01 15h 26m

Nominal site altitude 50m

E. Longit.   Latitude     U.T.    Sun  Moon   TanZ   PA    AA      CA
   o  '  "    o  '  "   h  m  s   Alt Alt Az          o     o      o
 112  0  0  -30 11 35  15 13 34       26  90  2.03 203.6 181.29   1.74S
 112 30  0  -30 25 47  15 14 13       27  89  1.98 203.6 181.35   1.80S
 113  0  0  -30 40  7  15 14 53       27  89  1.93 203.7 181.41   1.86S
 113 30  0  -30 54 37  15 15 34       28  88  1.88 203.7 181.47   1.92S
 114  0  0  -31  9 15  15 16 15       29  88  1.84 203.8 181.53   1.98S
 114 30  0  -31 24  3  15 16 58       29  87  1.80 203.8 181.59   2.04S
 115  0  0  -31 38 59  15 17 41       30  87  1.75 203.9 181.65   2.09S
 115 30  0  -31 54  4  15 18 26       30  86  1.72 204.0 181.70   2.15S
 116  0  0  -32  9 18  15 19 11       31  86  1.68 204.0 181.76   2.20S
 116 30  0  -32 24 39  15 19 57       31  85  1.64 204.1 181.81   2.25S
 117  0  0  -32 40  9  15 20 44       32  85  1.60 204.1 181.86   2.31S
 117 30  0  -32 55 47  15 21 31       32  84  1.57 204.2 181.91   2.36S
 118  0  0  -33 11 32  15 22 20       33  83  1.54 204.2 181.96   2.40S
 118 30  0  -33 27 25  15 23  9       34  83  1.50 204.3 182.01   2.45S
 119  0  0  -33 43 25  15 23 59       34  82  1.47 204.3 182.05   2.50S
 119 30  0  -33 59 32  15 24 50       35  82  1.44 204.3 182.09   2.54S
 120  0  0  -34 15 46  15 25 41       35  81  1.42 204.4 182.14   2.58S

Path coordinates are referred to WGS84 (as used by GPS), with the
nominal site altitude being referenced to Mean Sea Level.

1971 is triple:
  Graze prediction is based on the mean position of AB 5.66 8.47 1.12" 307.6
 (BU  935) Graze path of A 0.04 km north, and 0.2 secs later compared to prediction
  Graze path of B 0.60 km south, and 2.1 secs earlier compared to prediction

  AB 5.66 8.47 1.12" 307.6 (BU  935) Graze path of B 0.64 km south, and 2.2 secs earlier compared to A
  AC 5.7 11.9 26.8" 165.0 (STF1780) Graze path of C 50.74 km north, and 34.1 secs later compared to A

                Librations  Long -2.98   Lat +1.68
                            P +181.65     D +2.03
      Illumination of moon  83%-
        Elongation of Moon  132
    Vertical Profile Scale  2.38 km/arcsec at mean distance of moon
   Horizontal Scale Factor  1.77 deg/min


At longitude 116.00:
Limiting Magnitudes for various telescope apertures (in cm)
      CA\Tdia   5    10    15    20    25    30    35
    -1.8      2.6   3.9   4.7   5.1   5.4   5.5   5.7
     0.2      2.6   3.9   4.7   5.1   5.4   5.5   5.7
     2.2      2.6   3.9   4.7   5.1   5.4   5.5   5.7
     4.2      4.5   5.9   6.6   7.1   7.4   7.6   7.7
     6.2      4.5   5.9   6.6   7.1   7.4   7.6   7.7

------------------------------------------------------------------------------
Double star catalogue details
WDS entries

  RA  Dec Name          Y1   Y2     N  PA  PA   Sep   Sep  M1    M2
13459-1226BU  935AB    1879 1991   19 298 306   1.6   1.2  5.66  8.47 G8III     -021+006 -021+006 -11 3591 N D  134556.33-122535.6
13459-1226STF1780AC    1879 1998   16 165 165  26.9  26.8  5.66 11.9  G8III     -021+006 -016+005          N D  134556.33-122535.6
13459-1226STF1780CD    1879 1958   12 274 272   1.7   2.4 11.9  13.1            -016+005                   N    134556.84-122601.1

------------------------------------------------
Interferometric catalogue entries

134556.33-122535.6  ADS  9018                 BU  935AB                 HD 119853    HIP  67172         13459-1226 N
    Date       PA              Sep                  M1             M2
  1991.25     304.8     .      1.132      .         5.734  0.003   8.396  0.031    511 222   0.3   1  HIP1997a Hh
  1991.25        .      .       .         .         5.70    .      8.39   0.01     505  97   0.3   1  Fab2000a Hh
  1991.25        .      .       .         .         6.78    .      8.97   0.01     435  70   0.3   1  Fab2000a Hh
  1991.44     306.1     .      1.187      .         5.661  0.010   8.474  0.019    530 100   1.4   1  TYC2000a Ht
  1991.44        .      .       .         .         6.737  0.015   8.939  0.022    430  90   1.4   1  TYC2000a Ht


------------------------------------------------------------------------------
Results of Observer Scan                                    UT
Site                              Long.   Lat.   Dist.    h  m  s
Lunar Limb Profile