Predictions for Grazing Occultation of S 161834, 2013 Oct 11, near Perth
Graze profile
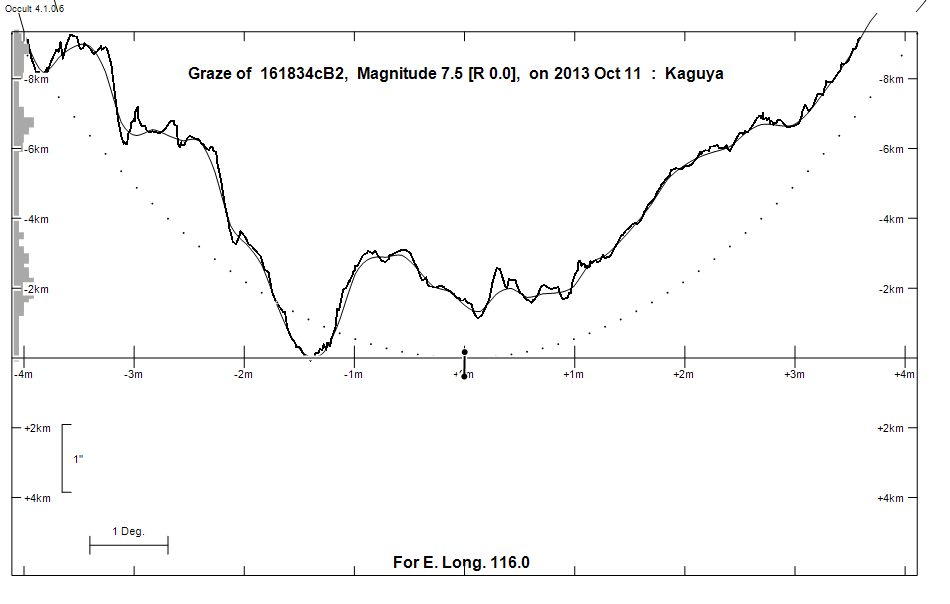
Grazing Occultation of  161834cB2      Magnitude 7.5 [Red = 0.0]
Date: 2013 Oct 11 11h 16m,  to  2013 Oct 11 11h 33m

Nominal site altitude 50m

E. Longit.   Latitude     U.T.    Sun  Moon   TanZ   PA    AA      CA
   o  '  "    o  '  "   h  m  s   Alt Alt Az          o     o      o
 112  0  0  -32 14 48  11 16  0   -8  68 304  0.41 165.8 169.88   8.84S
 112 30  0  -32  5 13  11 17  6   -9  67 303  0.41 165.7 169.77   8.94S
 113  0  0  -31 55 27  11 18 11   -9  67 301  0.42 165.6 169.67   9.05S
 113 30  0  -31 45 32  11 19 17  -10  67 300  0.43 165.4 169.56   9.15S
 114  0  0  -31 35 27  11 20 22  -11  66 298  0.44 165.3 169.46   9.25S
 114 30  0  -31 25 13  11 21 28  -12  66 297  0.46 165.2 169.36   9.35S
 115  0  0  -31 14 48  11 22 33       65 295  0.47 165.1 169.26   9.45S
 115 30  0  -31  4 15  11 23 38       64 294  0.48 165.1 169.17   9.55S
 116  0  0  -30 53 32  11 24 43       64 293  0.49 165.0 169.08   9.64S
 116 30  0  -30 42 39  11 25 49       63 292  0.50 164.9 168.98   9.73S
 117  0  0  -30 31 38  11 26 54       63 290  0.51 164.8 168.90   9.82S
 117 30  0  -30 20 28  11 27 59       62 289  0.53 164.7 168.81   9.91S
 118  0  0  -30  9  9  11 29  3       62 288  0.54 164.6 168.72   9.99S
 118 30  0  -29 57 41  11 30  8       61 287  0.55 164.5 168.64  10.07S
 119  0  0  -29 46  6  11 31 12       61 286  0.56 164.4 168.56  10.15S
 119 30  0  -29 34 22  11 32 16       60 285  0.58 164.4 168.49  10.23S
 120  0  0  -29 22 30  11 33 20       59 284  0.59 164.3 168.41  10.30S

Path coordinates are referred to WGS84 (as used by GPS), with the
nominal site altitude being referenced to Mean Sea Level.

161834 is double:
  Graze prediction is based on the mean position of AB 7.75 9.00 0.40" 153.5
 (RST3198) Graze path of A 0.19 km south, and 0.0 secs earlier compared to prediction
  Graze path of B 0.60 km north, and 0.2 secs later compared to prediction

  AB 7.75 9.00 0.40" 153.5 (RST3198) Graze path of B 0.79 km north, and 0.2 secs later compared to A

                Librations  Long -0.12   Lat -6.37
                            P +169.03     D -6.02
      Illumination of moon  44%+
        Elongation of Moon  83
    Vertical Profile Scale  1.95 km/arcsec at mean distance of moon
   Horizontal Scale Factor  1.41 deg/min


At longitude 116.00:
Limiting Magnitudes for various telescope apertures (in cm)
      CA\Tdia   5    10    15    20    25    30    35
     5.6      5.9   7.4   8.2   8.8   9.2   9.5   9.7
     7.6      6.0   7.4   8.3   8.8   9.2   9.5   9.7
     9.6      6.0   7.4   8.3   8.8   9.2   9.5   9.7
    11.6      6.0   7.5   8.3   8.8   9.2   9.5   9.8
    13.6      6.0   7.5   8.3   8.8   9.2   9.5   9.8

------------------------------------------------------------------------------
Double star catalogue details
WDS entries

  RA  Dec Name          Y1   Y2     N  PA  PA   Sep   Sep  M1    M2
18480-1814RST3198      1934 2008   10 161 154   0.4   0.4  7.75  9.00 F2   A2   -003-003 -003-003 -18 5070   D  184758.42-181343.3

------------------------------------------------
Interferometric catalogue entries

184758.42-181343.3  BD-18 5070                RST3198                   HD 173805    HIP  92245         18480-1814
    Date       PA              Sep                  M1             M2
  1983.4203  :154.2     .   :  0.416      .          .      .       .      .       549  22   3.8   1  Hrt2000a Sc
  1984.3815   154.3     .      0.412      .          .      .       .      .       549  22   3.8   1  McA1987b Sc
  1988.2584   155.4     .      0.404      .          .      .       .      .       549  22   3.8   1  McA1989  Sc
  1991.25     154.      .      0.422      .         7.848  0.005   8.725  0.010    511 222   0.3   1  HIP1997a Hh
  1991.25        .      .       .         .         7.88    .      8.77   0.01     505  97   0.3   1  Fab2000a Hh
  1991.25        .      .       .         .         9.91    .      8.88   0.02     435  70   0.3   1  Fab2000a Hh
  1991.77     150.8     .      0.44       .         7.75   0.01    9.00   0.02     530 100   1.4   1  TYC2002  Ht
  1991.77        .      .       .         .         9.58   0.03    8.95   0.02     430  90   1.4   1  TYC2002  Ht
  2008.5427   154.0    0.0     0.4484    0.0002      .      .    : 1.3     .       551  22   4.0   1  Tok2010  S


------------------------------------------------------------------------------
Results of Observer Scan                                    UT
Site                              Long.   Lat.   Dist.    h  m  s
Lunar Limb Profile